

This report's win/loss figures, top-setup R-multiples, and daily narrative are temporarily withheld pending an independent data-methodology review (see the live case-study log for current status). 5 setups logged for July 26, 2026; outcomes will return once verified.
Browse archiveThe same dashboard that produced these case studies is open to subscribers. Watch tomorrow's setups print in real time.
Open the live dashboard →Observational research. The FSB system records hypotheses tied to backtest precedent and resolves them against subsequent market action. Some setups have no 90-day backtest precedent and are logged for transparency, not as recommendations. Losses are reported alongside wins. Past performance does not guarantee future results. Nothing here is personalised financial advice.
| Trading instruments peak status will update upon it's daily candle close. | |
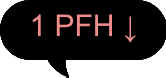
| PFH | Peak Formation High |
| PFL | Peak Formation Low |
| Status | Direction & Location of Peak |
|
PFL |
Bullish Trend |
|
PFH |
Bearish Trend |

|
New Peak (Trend) |
| 1.18 | Flashing means Trend has reached 3.0 ADR or more. Typical MM trends last 3.0x ADR before reversing.*Typical (Updates By The Minute)* |
| 3.00 | |
| 4.59 | |

|
Previous Peak is dimmed |
|
Current active peak |